In the previous post, I used SQL and Python to clean NYC taxi and Uber data in 2015. In this post, I performed data exploration and visualization using Pandas and Tableau, and present some interesting patterns of taxi trips in NYC.
Table of Contents
Taxi is popular in New York
On average, there are over 16 thousands yellow taxi trips and 2 thousand green taxi trips every hour, total over 13 million trips every month. Considering there are 8 million people living in New York, this means on average, each New Yorker takes 1.5 taxi trips each month, and 20 taxi trips every year! No wonder taxi is a Big Apple icon [1].

When do people take taxi?

- Green taxi peaked in March-May (Spring). This may be due to increased tourism from spring break, more spring activities in Brooklyn. There is another peak in October, which may be a seasonal event.
- Yellow taxi increased by 1 M from February to March.
- Both yellow and green taxis plunged in summer and hit the bottom in Aug/Sept, and this is likely due to the increasing business and competition from Uber [2], which showed great increase from 2 M to 3 M (150%!) in 6 month.
Clearly, Uber was competing with traditional taxi business in 2015. And now we have many Uber-like car sharing services, and the competition is more intense! How to best capture the taxi market is the crucial question for both traditional taxi and the new sharing taxis.
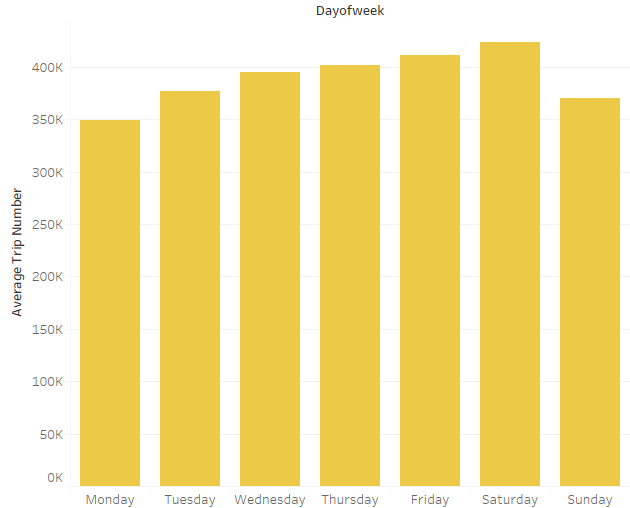
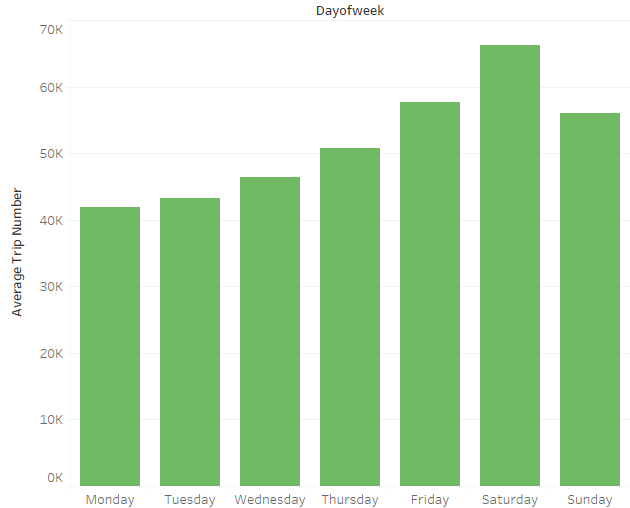
There were more taxi trips on weekend than weekday. The trend was more noticeable for green taxi: daily trip increased from Monday, and reached peak on Saturday (50+% increase compared to Monday) then dropped sharply on Sunday. Since Green Taxi operates mainly outside Manhattan, it is interesting to check where it experienced the highest increase.
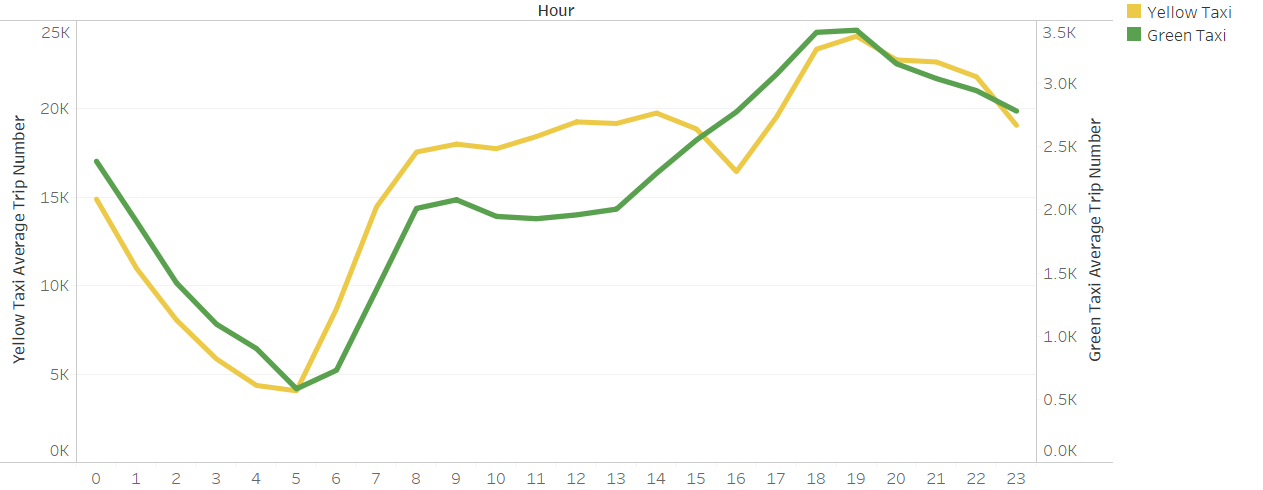
Both yellow and green taxis reached the lowest hourly trip at 5 am. Yellow taxi had another drop at 5 pm, which is probably because 4-5 pm is the time when many taxis switch drivers [3]. Both taxis had a morning peak 8-9 pm and an evening peak at 6-7 pm. This is likely due to rush hour of people going to work and getting off work.
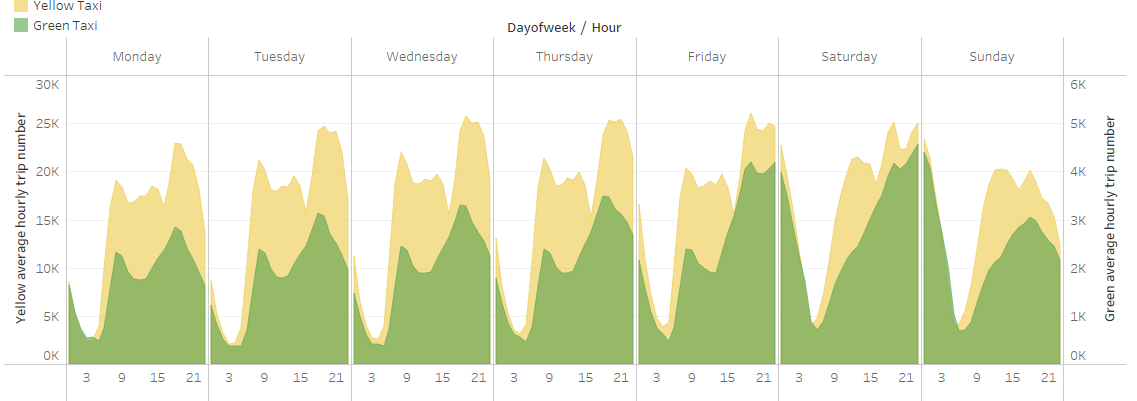
Daily traffic pattern is quite consistent for both taxis on weekdays (Mon-Thur): morning and evening peaks. Both taxis have highest traffic starting from Friday night and decreasing on Sunday afternoon. In particular, green taxi daily trips increased from Monday and peaked on Saturday. On Friday evening, there started to have more trips and lasted over night.
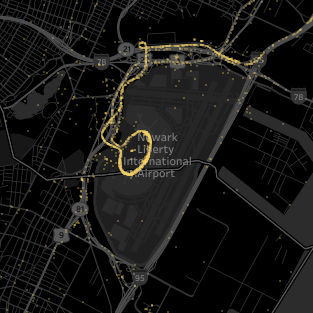
Where do taxis pick up and drop off passengers?
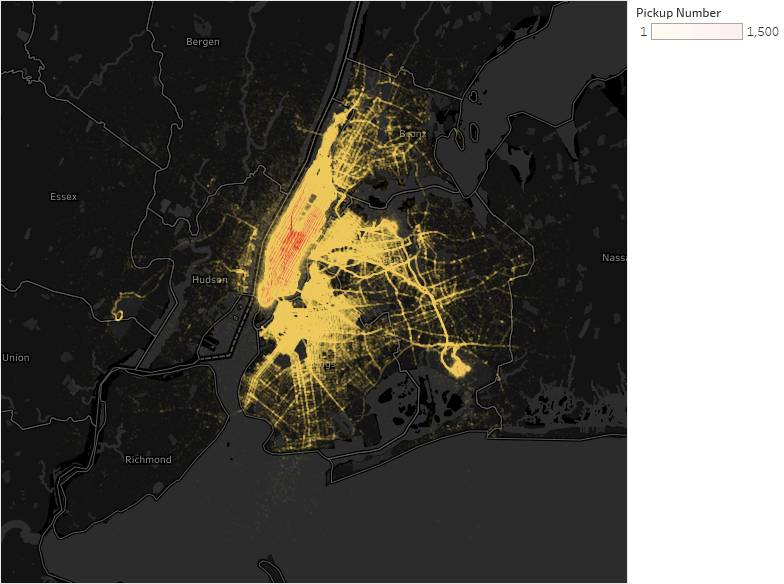
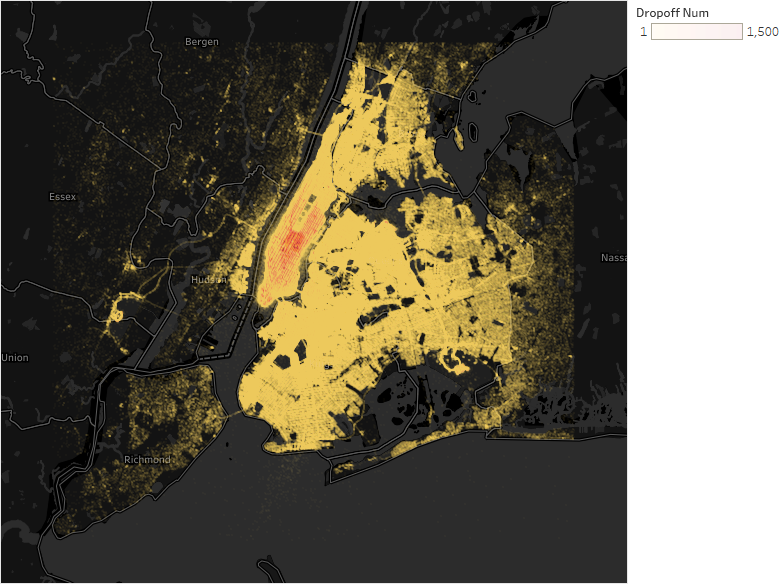
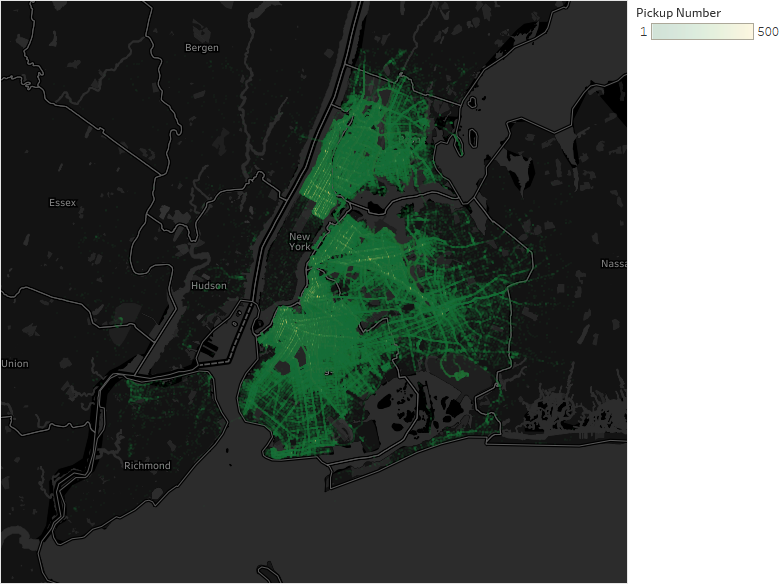
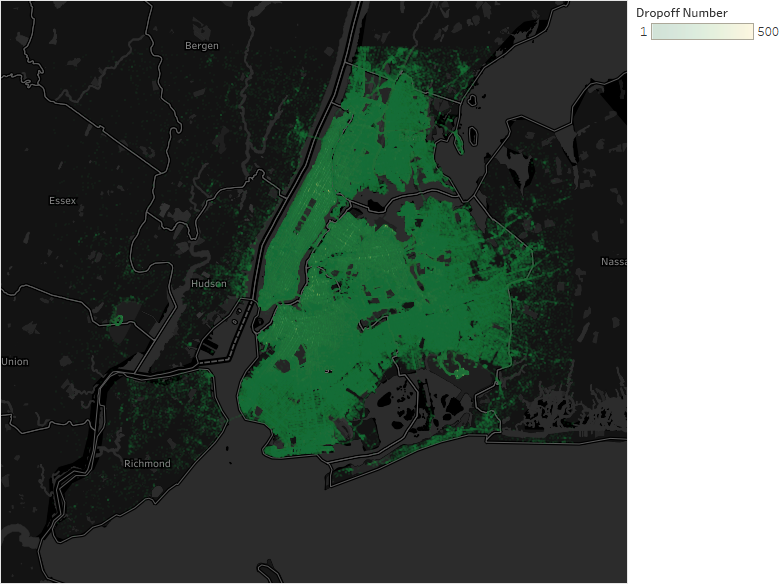
From the geographical heat map, I discover several interesting patterns:
1. Yellow taxi had heavy pickup in midtown and downtown Manhattan. Green taxi, which is not allowed to pick up passengers below 110th street, had almost zero pickup in Manhattan.
2. Yellow taxi had heavy pickup at all 3 New York airports (JFK, LGA, EWR)

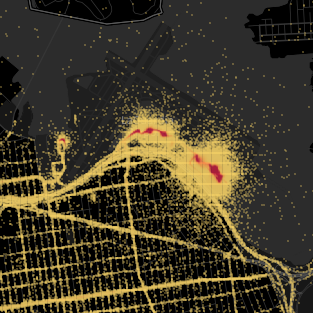
3. Green taxi was most concentrated in Brooklyn and Bronx.
4. Both yellow and green taxi had widely distributed dropoff traffic compared to pickup traffic. Yellow taxi pickup traffic traffic was most concentrated in Manhattan while dropoff traffic spreads more widely, to Brooklyn, Queens, and Bronx; Green taxi was allowed to drop off passengers in Manhattan.
5. There were more pickup and dropoffs on main avenues, such as Broadway.

6. Note there was also high traffic at New Jersey near Hudson river. Since a considerable number of people working in Manhattan are living in New Jersey and commute to work, this high taxi traffic is not unexpected.
Target Brooklyn
Since Green taxi showed very sharp temporal change during weekends, I decided to focus on Green taxi, which mainly operated in Brooklyn and Bronx. I focus on my analysis in Brooklyn. Check my next post.
References
[1] The iconic yellow taxi is still twice as popular as Uber in the Big Apple, http://www.digitaltrends.com/mobile/nyc-taxi-2x-more-than-uber-trips/
[2] Manhattan taxi trips plunge almost 4 million in 3 months: analysis, http://www.amny.com/transit/manhattan-taxi-trips-plunge-almost-4-million-in-3-months-analysis-1.10984180
[3] Taxi capacity in NYC – the 4 O’Clock Bliphttps://mswd.wordpress.com/2011/01/12/taxi-capacity-in-nyc-the-4-oclock-blip/